I wrote a GreaseMonkey script to show a graph of downloads over time using the Pling download table.
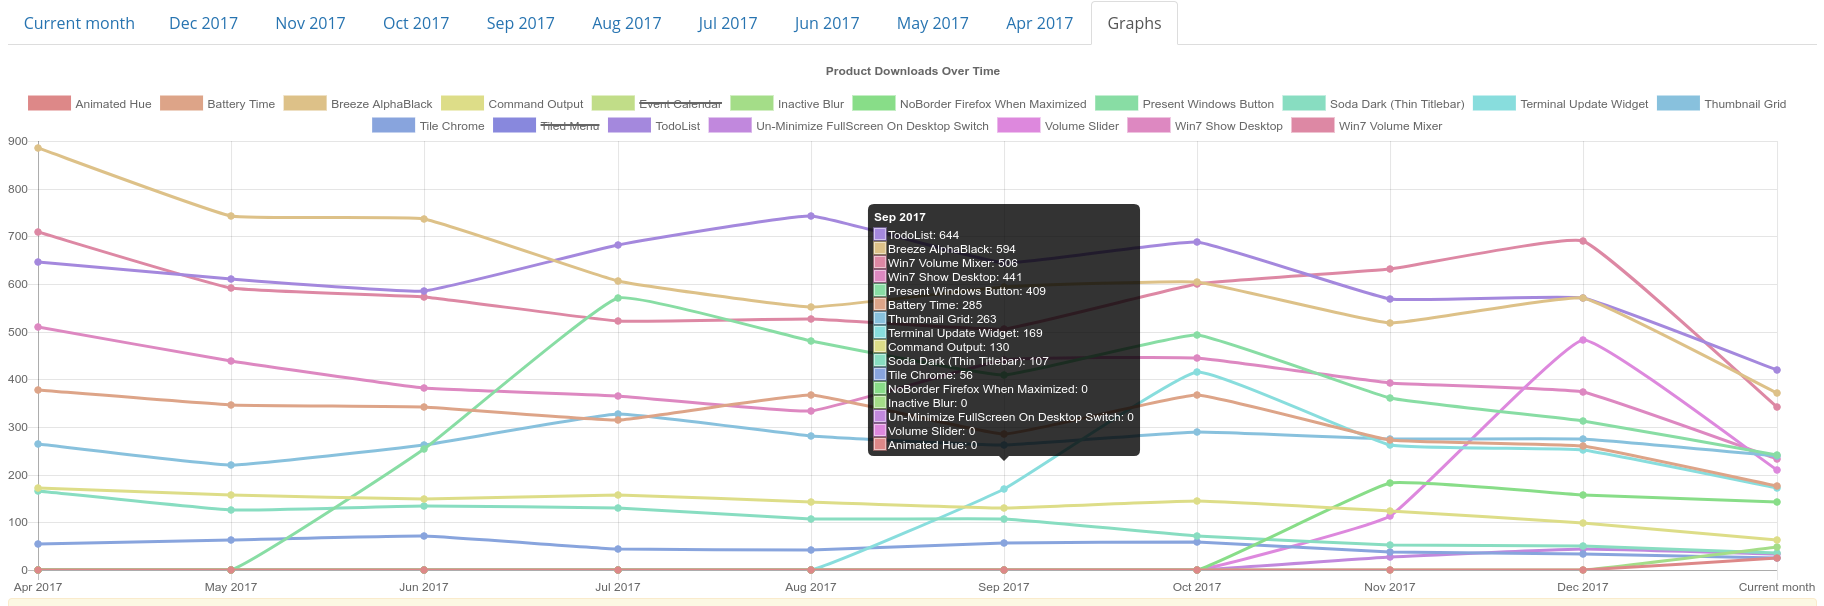
It uses Chart.JS, and you can hover a product in the legend to have the other product data fade out so it’s easier to focus on.
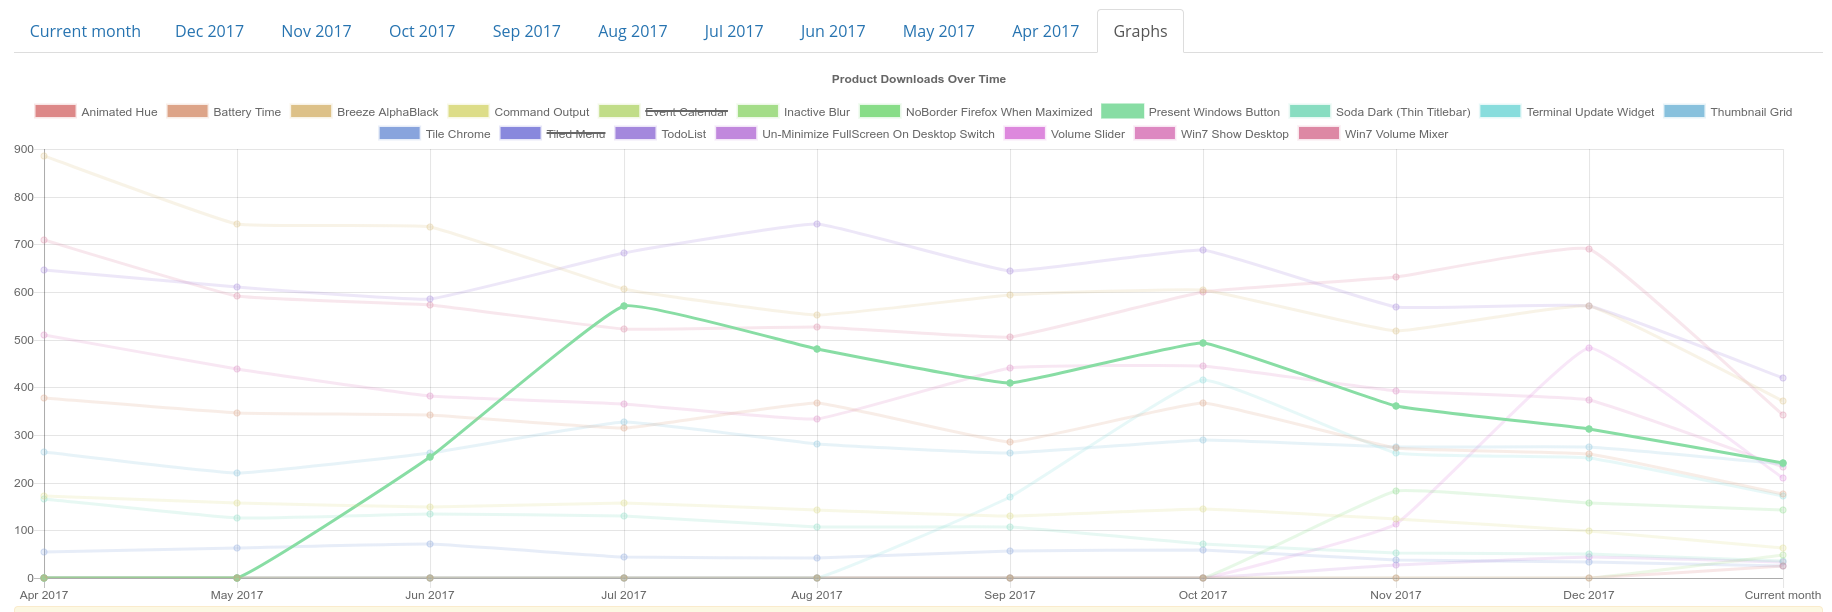
After installing Tampermonkey (Chrome) or GreaseMonkey (FireFox), visit the Plings page and select the newly created “Graphs” tab.
